 1
U.S. Auto Parts Network, Inc.
Leading online source for automotive aftermarket parts and repair information
Investor Presentation
March 11, 2014
Exhibit 99.1 |
| 1
U.S. Auto Parts Network, Inc.
Leading online source for automotive aftermarket parts and repair information
Investor Presentation
March 11, 2014
Exhibit 99.1 |
 Safe
Harbor This presentation may contain certain forward-looking statements and
management may make additional forward-looking statements in response to
your questions. These statements do not guarantee future performance and
speak only as of the date hereof, and qualify for the safe harbor provided by
Section 21E of the Securities Exchange Act of 1934, as amended, and Section
27A of the Securities Act of 1933. We refer all of you to the risk
factors contained in US Auto Parts Annual Report on Form 10-K and
quarterly reports on
Form
10-Q
filed
with
the
Securities
and
Exchange
Commission,
for
more
detailed
discussion
on
the
factors
that
can
cause
actual
results
to
differ
materially from those projected in any forward-looking statements.
2 |
 3
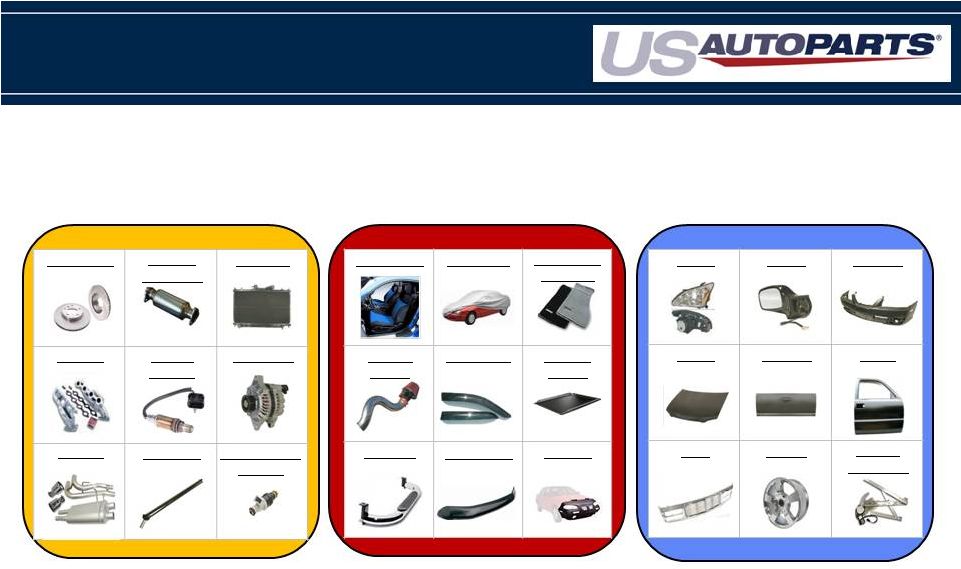
Broad Auto Parts Product Offering
Body Parts
Engine Parts
Performance & Accessories
*Represents USAP online mix
**Source; AAIA Factbook Research
19%
41%
40%
$15B
$15B
Revenue*
Overall Market**
$50B
Brake Discs
Catalytic
Converters
Radiators
Headers
Oxygen
Sensors
Alternators
Exhaust
Driveshaft
Fuel Injection /
Delivery
Lamps
Mirrors
Bumpers
Hoods
Tailgates
Doors
Grills
Wheels
Window
Regulators
Seat Covers
Car Covers
Floor Mats /
Carpeting
Cold Air
Intakes
Vent Visors
Tonneau
Covers
Nerf Bars
Bug Shields
Car Bras |
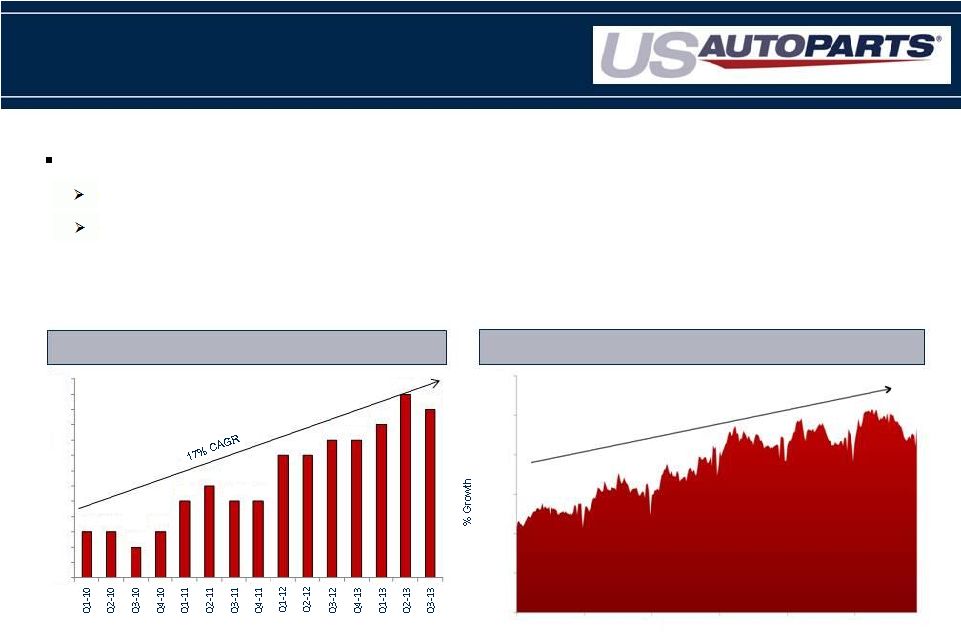 Online
sales
of
automotive
parts
and
accessories
continue
to
grow
Google
has
experienced
a
6
year
compound
annual
growth
rate
(“CAGR”)
of
16%
in
queries
for
automotive
parts
4
$1.3
$1.3
$1.2
$1.3
$1.5
$1.6
$1.5
$1.5
$1.8
$1.8
$1.9
$1.9
$2.0
$2.2
$2.1
$1.0
$1.1
$1.2
$1.3
$1.4
$1.5
$1.6
$1.7
$1.8
$1.9
$2.0
$2.1
$2.2
$2.3
Source: eBay filings, press releases
Source: Google
eBay Parts Sales Continue to Increase
Google Queries for Parts Growing
Online Market is Vibrant and Growing
Aftermarket e-Commerce Overview
Mobile year over year queries increased 50% and 80% for cellphones and tablets, respectively, for
September 2013 YTD 300%
250%
200%
150%
100%
50%
0%
2008
2009
2010
2011
2012
2013
16% CAGR |
 Online penetration for auto parts has trailed penetration rates of other consumer
product categories for two reasons: 1)
Auto parts are traditionally bought by demographics that have lower internet
access rates We believe consumer buying will shift from offline to online as
mobile device penetration increases for these demographics 2)
Shopping for auto parts online can be difficult for consumers
The complexity required to buy an auto part online increases consumers concerns it
will not fit their vehicle Online retailers continue to make improvements to
online shopping, reducing concerns and increasing conversion Size and
Penetration of Online Automotive Parts Aftermarket e-Commerce
Overview 5
Source: Morgan Stanley and Forrester Research
Low Automotive Online Sales Penetration
Source: AAIA
Estimate
based
on
AAAI
Fact
book
-
$85B
in
parts,
$70B
in
labor
* Excludes eBay
Automotive Aftermarket by Segment
Desire to Repair
High
Low
$155B
Do-It-For-Me
$45B
Do-It-Yourself
(USAP Target Market)
$3.1B-$4.0B
Online Sales*
High
Online penetration rates for most
consumer products categories
range from 4% to 6%
Online sales of automotive
parts significantly lag other
product categories
45%
27%
24%
24%
21%
19%
19%
18%
13%
12%
11%
10%
10%
9%
9%
8%
6%
5%
4%
3%
1%
Product Category |
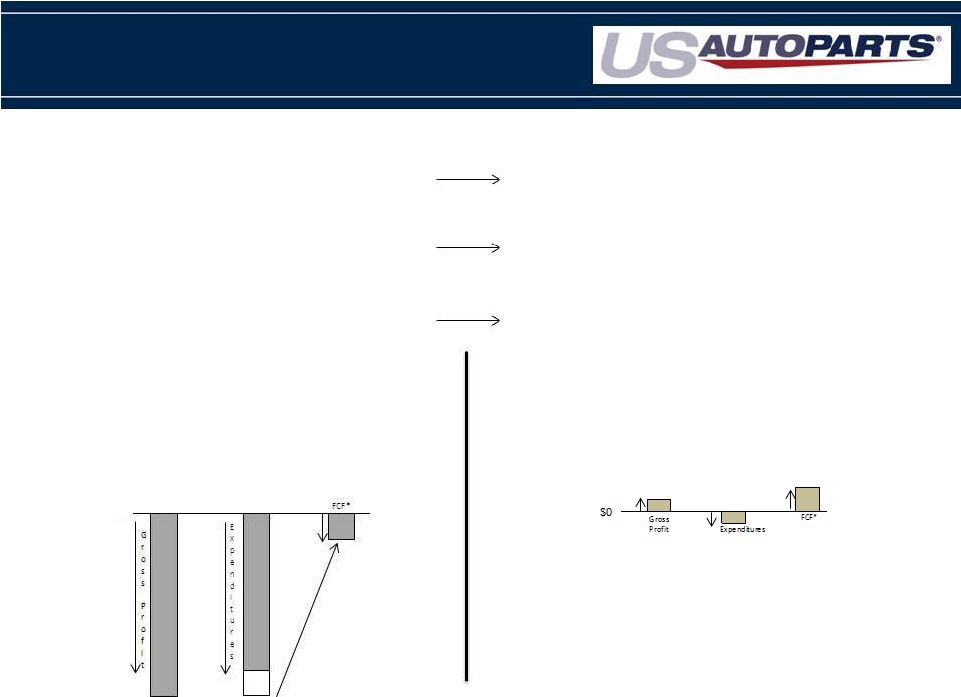 Changes to Our Business
6
* FCF is defined as Adjusted EBITDA less CAPX
2012 -
2013
•
Traffic and revenue declined resulting from
search engine changes forcing us to
consolidate websites
•
Gross margin compression from increased
competition
•
Cost reductions could not be eliminated fast
enough to keep up with gross profit dollar
lost
Go Forward
•
Traffic is stabilizing and revenue from go
forward sales channels has turned slightly
positive
•
Larger focus on Private Label business with
healthier margins at competitive prices
•
Cost reductions have now exceeded gross
profit
dollars
loss
from
2012
–
2013
$0 |
 Product Assortment
•
Over 50% of product sales directly sourced from
Asia
•
Transition away from lower margin stock ship
branded product while expanding private label mix
•
Broad assortment
Marketing
•
Over 10 million unique monthly visitors to our
websites
•
Unique visitors more than two times higher then
any other auto parts retailer
•
$7 customer acquisition cost (“CAC”)
USAP has two main competitive advantages
Competitive Advantages
•
Over 40,000 private label SKUs
•
Over 1.5M branded SKUs
7 |
 USAP’s Supply Chain Creates Pricing Advantage
USAP’s ability to competitively price products while maintaining healthy
margins is a function of the Company’s ability to leverage its robust
private label supply chain. The Company is working to increase margins by
shifting its product mix toward increased private label offerings
-
current
margins
range
from
29%
-
31%
The Company sources product directly from over 200 factories in Asia
8
Margin %
In-Stock
Private Label
(Asia Sourced)
Branded
(U.S. Sourced)
40% -
70%
25% -
40%
10% -
25%
Drop Shipped
Current Mix
55%
45%
Current Mix
63%
37%
75%
25%
Goal
70%
30%
Goal |
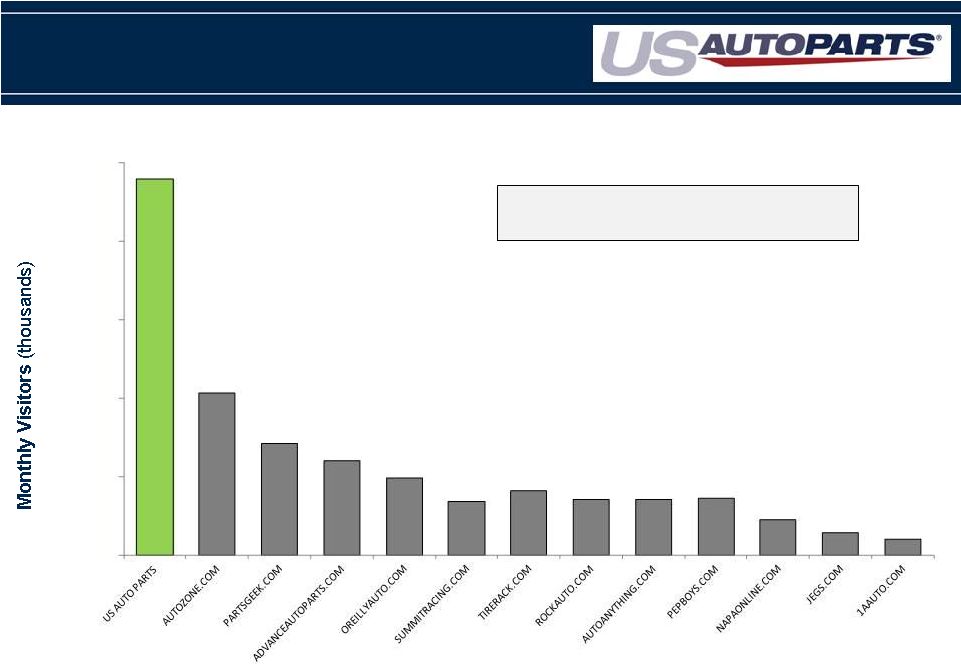 US
Auto
Parts
Dominant
Reach-
Largest
Pure Play Internet Retailer
9
0
2,000
4,000
6,000
8,000
10,000
USAP traffic includes traffic from USAP continued sales channels and WAG since the
acquisition
Competitive sites’ traffic based on Compete December 2013 reports
(some overlap of monthly visitors across websites)
USAP’s traffic is 2x larger than any other
pure play online auto parts seller |
 Revenue
100%
Gross Margins
29% -
31%
Variable OPEX Costs
15%
Fixed Costs
0%
Incremental Flow Thru
14% -
16%
10
Growth and Profitability
Incremental Flow Thru |
 11
•
Excludes stock based compensation, depreciation and amortization
•
For every incremental year required to achieve growth levels, fixed expenses
increase $1.0M or 3% Financial Sensitivity
Our business model has significant cost leverage as revenues grow
Base
10%
20%
30%
40%
Revenue
$250
$275
$300
$325
$350
Gross Margin %
Variable:
Fulfillment
3.2%
3.2%
3.2%
3.2%
3.2%
Marketing
9.3%
9.3%
9.3%
9.3%
9.3%
Technology
0.7%
0.7%
0.7%
0.7%
0.7%
G&A
1.8%
1.8%
1.8%
1.8%
1.8%
Total Variable
14.9%
14.9%
14.9%
14.9%
14.9%
Fixed:
Fulfillment
2.5%
2.2%
2.0%
1.9%
1.8%
Marketing
4.0%
3.6%
3.3%
3.0%
2.8%
Technology
1.2%
1.1%
1.0%
0.9%
0.9%
G&A
4.0%
3.6%
3.3%
3.1%
2.9%
Total Fixed
11.6%
10.6%
9.7%
9.0%
8.3%
Adjusted EBITDA %
Adjusted EBITDA $
$6 –
$11
$10 –
$15
$13 –
$19
$17 –
$23
$20 –
$27
29.0% –
31.0%
29.0% –
31.0%
29.0% –
31.0%
29.0% –
31.0%
29.0% –
31.0%
2.4% –
4.4%
3.5% –
5.5%
4.4% –
6.4%
5.1% –
7.1%
5.8% –
7.8% |
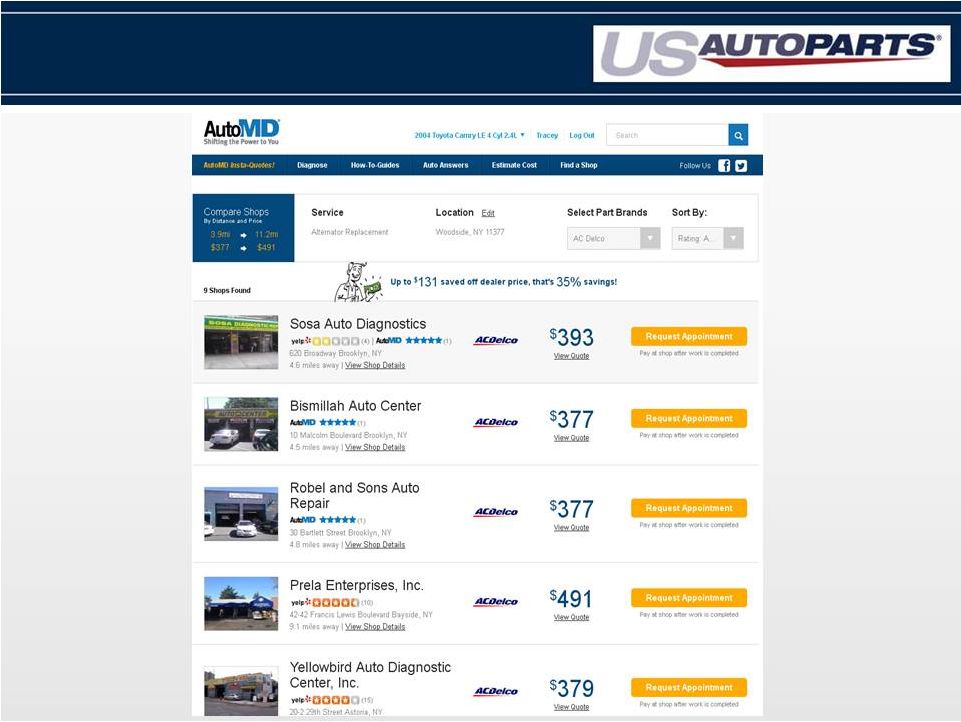 12
AutoMD –
Addressing the DIFM Market |
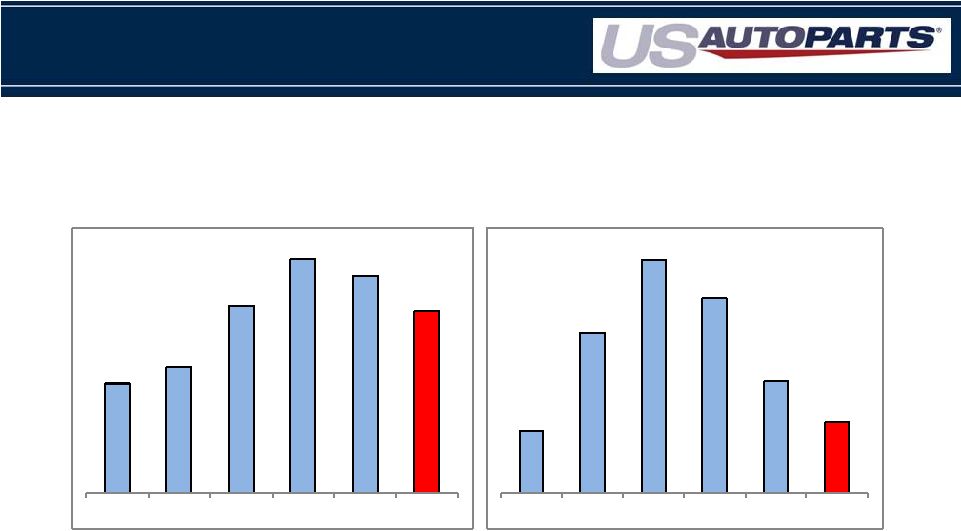 $153.4
$176.3
$262.3
$327.1
$304.0
$254.8
2008
2009
2010
2011
2012
2013
$5.2
$13.5
$19.5
$16.3
$9.4
$6.0
2008
2009
2010
2011
2012
2013
13
Sales & Adjusted EBITDA
Consolidated
Sales
1
Consolidated
Adjusted
EBITDA
2
($ In Millions)
($ In Millions)
Adj. EBITDA Margin
3%
5%
8%
7%
3%
2%
1.
JC Whitney was acquired in Aug 2010 adding revenue of $39.1M in 2010 and $83.4M in 2011. Amounts
not separately disclosed after 2011.
2.
Non-GAAP financial measure EBITDA consists of net income before (a) interest expense, net; (b)
income tax provisions; (c) amortization of intangible assets; (d) depreciation and
amortization. Adjusted EBITDA excludes restructuring costs and other one time charges of $0.4M,
$5.8M, $8.0M, $0.7M and $0.8M in 2009, 2010, 2011, 2012 and 2013, respectively, stock based
compensation of $2.9M, $3.3M, $2.7M, $2.6M, $1.7M and $1.3M in 2008, 2009, 2010, 2011, 2012 and 2013 respectively. There were no restructuring or other one time
charges in 2008.
|
 Recent Revenue Trends
Completed the retirement of a number of websites by the end of 2Q ‘13
14 |
 Adjusted EBITDA
(Non-GAAP
Financial Measure – in thousands
)
15
Thirteen Weeks Ended
Fifty-Two Weeks Ended
December 28
December 29
December 28
December 29
2013
2012
2013
2012
Net loss
(1,325)
$
(30,783)
$
(15,634)
$
(35,978)
$
Interest expense, net
276
274
972
774
Income tax provision
(48)
(1,230)
43
(937)
Amortization of intangible assets
82
177
381
1,189
Depreciation and amortization expense
2,439
3,671
12,175
15,204
EBITDA
1,424
(27,891)
(2,063)
(19,748)
Impairment loss on goodwill
-
18,854
-
18,854
Impairment loss on property and equipment
-
1,960
4,832
1,960
Impairment loss on intangible assets
-
5,613
1,245
5,613
Shared-based compensation expense
198
265
1,263
1,673
Loss on debt extinguishment
-
-
-
360
Legal costs related to intellectual property
-
67
-
67
Restructuring costs
-
-
723
640
Adjusted EBITDA
1,622
$
(1,132)
$
6,000
$
9,419
$
|
 Consolidated Statements of Comprehensive Operations
(Unaudited, in Thousands, Except Per Share Data)
16
Thirteen Weeks Ended
Fifty-two Weeks Ended
December 28
December 29
December 28
December 29
2013
2012
2013
2012
Net sales
59,735
$
62,848
$
254,753
$
304,017
$
Cost of sales
(1)
42,260
45,072
180,620
212,379
Gross profit
17,475
17,776
74,133
91,638
Operating expenses:
Marketing
9,284
12,079
41,045
51,416
General and administrative
3,941
4,347
17,567
19,857
Fulfillment
4,112
5,023
18,702
22,265
Technology
1,093
1,448
5,128
6,274
Amortization of intangible
assets 82
177
381
1,189
Impairment loss on
goodwill -
18,854
-
18,854
Impairment loss on property and
equipment -
1,960
4,832
1,960
Impairment loss on
intangible assets -
5,613
1,245
5,613
Total operating expenses 18,512
49,501
88,900
127,428
Loss from operations
(1,037)
(31,725)
(14,767)
(35,790)
Other income (expense):
Other income (expense), net
(66)
(14)
148
20
Interest expense
(270)
(274)
(972)
(785)
Loss on debt
extinguishment -
-
-
(360)
Total other expense,
net (336)
(288)
(824)
(1,125)
Loss before income tax provision
(1,373)
(32,013)
(15,591)
(36,915)
Income tax provision
(48)
(1,230)
43
(937)
Net loss
(1,325)
(30,783)
(15,634)
(35,978)
Other comprehensive income, net of tax:
Foreign currency translation adjustments
24
(4)
55
31
Unrealized gains on investments
3
(4)
7
26
Total other comprehensive
income 27
(8)
62
57
Comprehensive
loss (1,298)
$
(30,791)
$
(15,572)
$
(35,921)
$
Basic and diluted net loss per share
(0.04)
$
(0.99)
$
(0.48)
$
(1.17)
$
Shares used in computation of basic and
diluted net loss per share
33,308
31,128
32,697
30,818
(1)
Excludes depreciation and amortization expense which is included in
marketing, general and administrative and fulfillment expense. |
 Consolidated Balance Sheets
(In Thousands, Except Par and Per Share Liquidation Value)
17
December 28
December 29
ASSETS
2013
2012
Current assets:
Cash and cash equivalents
818
$
1,030
$
Short-term investments
47
110
Accounts
receivable,
net
of
allowances
of
$213
and
$221
at December 28, 2013 and December 29, 2012, respectively
5,029
7,431
Inventory
36,986
42,727
Deferred income taxes
-
39
Other current assets
3,234
4,176
Total current assets
46,114
55,513
Property and equipment, net
19,663
28,559
Intangible assets, net
1,601
3,227
Other non-current assets
1,804
1,578
Total assets
69,182
$
88,877
$
LIABILITIES AND
STOCKHOLDERS' EQUITY Current liabilities:
Accounts payable
19,669
$
28,025
$
Accrued
expenses 5,959
10,485
Revolving loan payable
6,774
16,222
Current portion of capital leases payable
269
70
Other current liabilities
3,682
4,738
Total current liabilities
36,353
59,540
Capital leases payable, net of current portion
9,502
70
Deferred income taxes
335
314
Other non-current liabilities
2,126
1,309
Total liabilities
48,316
61,233
Commitments and contingencies
Stockholders' equity:
Series A convertible preferred stock, $0.001 par value; $1.45
per share liquidation value or aggregate of $6,017; 4,150
shares authorized; 4,150 and 0 shares issued and outstanding
at December 28, 2013 and December 29, 2012, respectively
4
-
Common stock, $0.001 par value; 100,000 shares authorized;
33,352 shares and 31,128 shares issued and outstanding
at December 28, 2013 and December 29, 2012, respectively
33
31
Additional paid-in capital
168,693
159,781
Common stock dividend distributable
60
-
Accumulated other comprehensive income
446
384
Accumulated deficit
(148,370)
(132,552)
Total stockholders' equity
20,866
27,644
Total liabilities and equity
69,182
$
88,877
$
|
 Thank You
18 |