 1
U.S. Auto Parts Network, Inc.
Leading online source for automotive aftermarket parts and repair information
Investor Presentation
December 2011
Exhibit 99.1 |
| 1
U.S. Auto Parts Network, Inc.
Leading online source for automotive aftermarket parts and repair information
Investor Presentation
December 2011
Exhibit 99.1 |
 Safe
Harbor 2
This
presentation
may
contain
certain
forward-looking
statements
and
management
may
make
additional
forward-looking
statements
in
response
to
your
questions.
These
statements
do
not
guarantee
future
performance
and
speak
only
as
of
the
date
hereof,
and
qualify
for
the
safe
harbor
provided
by
Section
21E
of
the
Securities
Exchange
Act
of
1934,
as
amended,
and
Section
27A
of
the
Securities
Act
of
1933.
We
refer
all
of
you
to
the
risk
factors
contained
in
US
Auto
Parts
Annual
Report
on
Form
10-K
and
quarterly
reports
on
Form
10-Q
filed
with
the
Securities
and
Exchange
Commission,
for
more
detailed
discussion
on
the
factors
that
can
cause
actual
results
to
differ
materially
from
those
projected
in
any
forward-looking
statements. |
 3
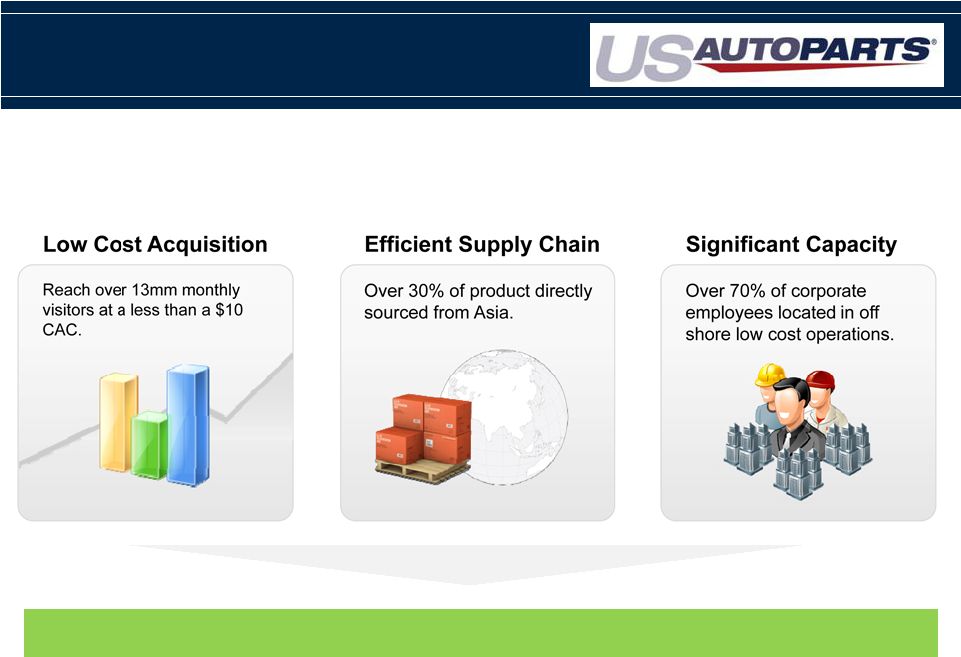
US Auto Parts Competitive Advantages
US Auto Parts is a dominant e-commerce specialty retailer of aftermarket auto
parts to the Do It Yourself market and is uniquely positioned to
win.
Incremental
revenue
above
current
levels
has
incremental
EBITDA
flow
thru
of
15%
-
20% |
 4
US Auto Parts History |
 5
Broad Product Offering Unavailable
from Traditional Off-Line Retailers
Brake Discs
Catalytic
Converters
Radiators
Headers
Oxygen
Sensors
Alternators
Exhaust
Driveshaft
Fuel Injection /
Delivery
Lamps
Mirrors
Bumpers
Hoods
Tailgates
Doors
Grills
Wheels
Window
Regulators
Seat Covers
Car Covers
Floor Mats /
Carpeting
Cold Air
Intakes
Vent Visors
Tonneau
Covers
Nerf Bars
Bug Shields
Car Bras
Body Parts
Engine Parts
Performance & Accessories
*Source; AAIA Factbook Research
28%
44%
28%
$15B
$15B
USAP Revenue
Overall Market*
$50B |
 6
Source : Forrester; Wall Street research; Autopartswarehouse.com
Low Online Penetration-
Mobile Growth
Opportunity |
  Online
vs. Brick and Mortar Customer – Mobile Growth Should Accelerate
Penetration 7
Los Angeles DMA
0.6%
0.6%
1.4%
5.6%
6.0%
8.4%
12.6%
7.3%
15.9%
18.7%
22.7%
0.1%
0.7%
0.1%
9.8%
14.9%
5.3%
9.6%
18.1%
5.1%
16.4%
19.8%
0.2%
0.6%
0.6%
6.2%
7.4%
7.6%
10.3%
11.3%
11.9%
16.0%
27.8%
Varying Lifestyles
Urban Essence
Rural Villages & Farms
Metro Fringe
Blue Collar Backbone
Small Town Contentment
American Diversity
Struggling Societies
Affluent Suburbia
Upscale America
Aspiring Contemporaries
All Households
Auto Zone
USAP
Compared to AutoZone and the general population, USAP
customers over-index in affluent segments, typical of
e-commerce shoppers
Affluent Suburbia
The wealthiest households in the U.S. living in exclusive suburban
neighborhoods enjoying the best of everything that life has to offer
Small Town Contentment
Middle-aged, upper-middle-class families living in small towns and
satellite cities with moderate educations employed in white-collar,
blue-collar and service professions
American Diversity
A diverse group of ethnically mixed singles and couples, middle-
aged and retired with middleclass incomes from blue-collar and
service industry jobs
In contrast, AutoZone store locations over-index in areas with
lower income, blue collar households
Struggling Societies
Young minorities, students and single parents trying to raise families
on low-level jobs in manufacturing, health care and food services
Blue Collar Backbone
Budget-conscious, young and old blue-collar households living in
older towns working in manufacturing, construction and retail trades
Metro Fringe
Racially mixed, lower-middle-class clusters in older single-family
homes, semi-detached houses and low-rise apartments in
satellite cities
* |
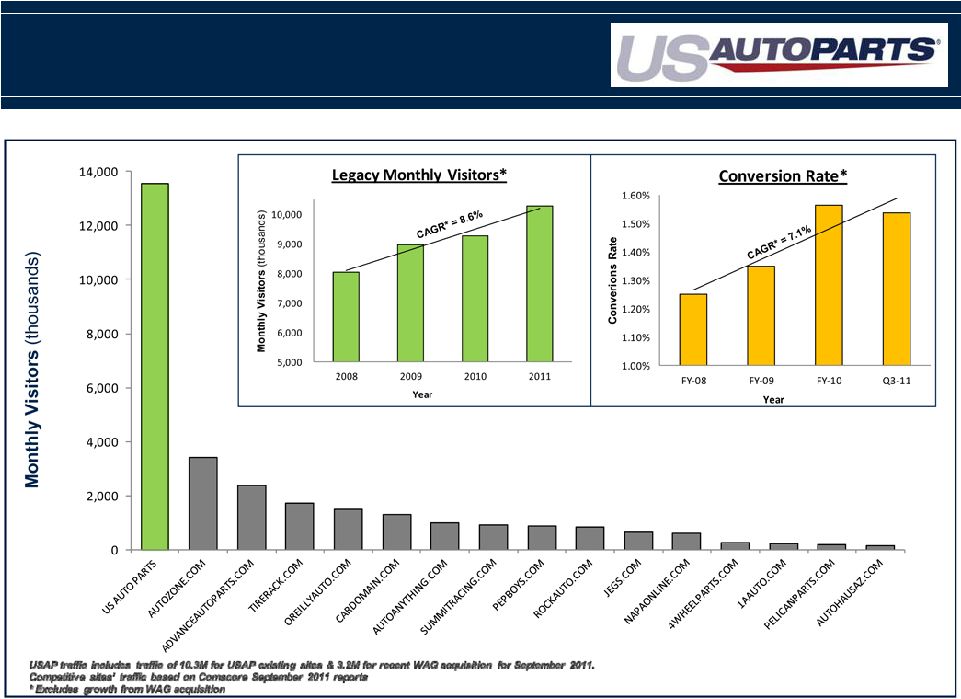 US
Auto Parts Dominant Reach- Largest
Pure Play Internet Retailer
(some overlap of monthly visitors across websites)
8 |
 Pricing Competitive Advantage Through
Supply Chain Efficiencies
9
Product margin/price competitiveness determined more by sourcing strategy
than product categories. Current margins range from 32% -
34%.
Margin %
75%
25% |
   Low
Cost Operating Structure Reduces Overhead and Enables Scale
10
Acquisition/Retention Marketing
Website Product Development
Call Center Operations
Product Sourcing
Catalog
Finance
Accounting
Analysis
IT
HR
Corporate Functions
Job functions are shared between the US and Philippines with a majority of the work
being performed in the Philippines. Total Corporate Employees
320
1,056
Distribution Centers
Carson, California (150,000 sq. ft.)
Chesapeake, Virginia (110,000 sq. ft)
LaSalle, Illinois (300,000 sq. ft)
106
90
Total Distribution Employees
196
99
99 |
 1)
Improve Customer Experience
Continue to improve all customer touch points
1)
Lower Prices
Launch disruptive price points through supply chain
efficiencies
2)
Increase Selection
Expand product offering within existing categories as
well as entering new categories
3)
Increase Unique Visitors
Drive increase unique visitors both organically and
through acquisitions
4)
Be the Consumer Advocate for Auto Repair
Reduce consumer spending on vehicle repair by
billions of dollars
1)
Increase Gross Margins
Expand Private Label direct import SKU’s
Increase stock shipments of Branded product
2)
Leverage Revenue Growth
Every
incremental
dollar
yields
15%
20%
EBITDA
flow
thru
3)
Monetize Web Traffic
Sell advertising and sponsorship on new inventory
11
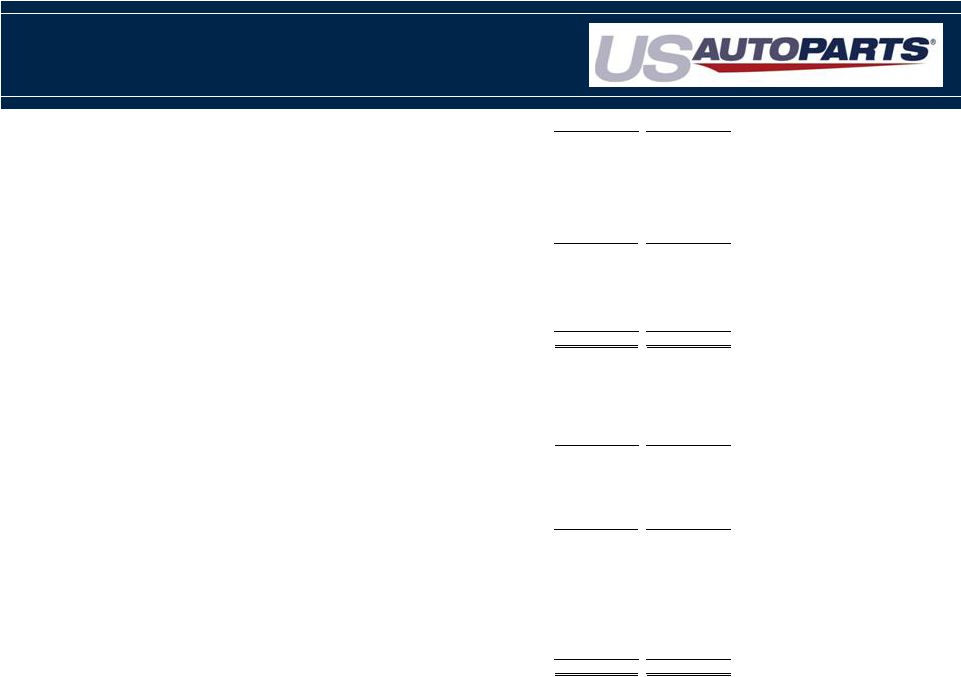
2011 Growth and Profitability
Revenue Growth
EBITDA Margin % Expansion |
 $153.4
$176.3
$262.2
$328.8
2008
2009
2010
2011
$5.2
$13.5
$19.5
$17.8
2008
2009
2010
2011
12
Sales & Adjusted EBITDA
Consolidated Sales
Consolidated Adjusted EBITDA
($ In Millions)
($ In Millions)
1.
Excludes
legal
cost
associated
with
protecting
our
intellectual
property.
2.
Excludes
legal
cost
associated
with
protecting
our
intellectual
property,
one
time
charge
for
revenue
recognition
change,
and
acquisition
costs
3.
Analysts
Estimates
for
FY-11.
Source
–
Yahoo
4.
Includes
a
sales
increase
of
approximately
$38.6
million
and
$40.0
million
in
2010
and
2011,
respectively
from
partial
and
full
year’s
results
related
to
the
acquisition
of
J.C.
Whitney
Adj. EBITDA Margin
(1)
(2)
3%
5%
8%
10%
(3)
Year Impacted by:
•
Search
engine
changes
impacting
high
converting
sites.
•
Resolution
anticipated
in
2H
2012
•
JCW Acquisition
•
Integration
competed
in
Q4
2011
&
anticipate
return
to
profitability
(3,4)
(4) |
 13
(millions$)
Growth
Base
10%
20%
30%
40%
50%
Revenue
Gross Margin
31%
-
34%
31%
-
34%
31%
-
34%
31%
-
34%
31%
-
34%
31%
-
34%
Variable:
Fufillment
Marketing
Technology
G&A
Total Variable
Fixed:
Fulfillment
Marketing
Technology
G&A
Total Fixed
Adjusted EBITDA
6%
-
9%
7%
-
10%
8%
-
11%
8%
-
11%
9%
-
12%
10%
-
13%
Adjusted EBITDA $
20
$
-
29
$
25
$
-
36
$
30
$
-
42
$
36
$
-
49
$
41
$
-
55
$
47
$
-
61
$
$488
14%
$325
$358
$390
$423
$455
2%
9%
1%
2%
14%
2%
9%
1%
2%
2%
9%
2%
14%
14%
9%
14%
14%
1%
2%
2%
1%
2%
9%
1%
2%
2%
1%
9%
2%
2%
4%
1%
3%
11%
9%
8%
8%
7%
2%
3%
1%
3%
2%
10%
3%
1%
3%
2%
3%
1%
2%
2%
1%
2%
2%
2%
3%
1%
2%
•
Reflects Whitney Automotive Group, fully integrated
•
Excludes stock based compensation, depreciation and amortization
•
For every incremental year required to achieve growth levels, fixed expenses
increase $1.2M Financial Sensitivity
Our
business
model
has
significant
cost
leverage
as
revenues
grow |
 AutoMD-
Largest DIY Site
Repositioned to Target $140B DIFM Market
14 |
 Adjusted EBITDA (Consolidated)
15
(Amounts shown in thousands)
Net (loss) income
$
(5,308)
$
(13,039)
$
(8,118)
$
(11,030)
Interest expense (income) net
283
187
719
132
Income tax provision
2
10,979
215
12,154
Amortization of intangibles
338
919
3,328
1,164
Depreciation and amortization
3,126
2,547
9,202
6,483
EBITDA
(1,559)
1,593
5,346
8,903
Share-based compensation
623
640
1,946
2,112
Legal costs to enforce intellectual property rights
211
306
443
2,199
Charge for change in revenue recognition
-
-
-
411
Add back Other Restructuring
3,815
1,590
6,591
1,590
Adjusted EBITDA
$
3,090
$
4,129
$
14,326
$
15,215
Thirteen Weeks
Ended
Thirteen Weeks
Ended
2010
2011
October 2
October 1
2010
2011
October 1
October 2
Thirty-Nine Weeks
Ended
Thirty-Nine Weeks
Ended |
 Adjusted EBITDA excluding JC Whitney
16
(Amounts shown in thousands)
Net income
$
214
$
(10,136)
$
4,617
$
(8,127)
Interest expense (income) net
280
139
719
83
Income tax provision
2
10,979
160
12,154
Amortization of intangibles
125
124
375
369
Depreciation and amortization
2,514
2,197
7,364
6,132
EBITDA
3,134
3,303
13,235
10,611
Share-based compensation
623
640
1,946
2,112
Legal costs to enforce intellectual property rights
211
306
443
2,199
Charge for change in revenue recognition
-
-
-
411
Adjusted EBITDA
$
3,968
$
4,249
$
15,624
$
15,333
2011
2010
2011
2010
Thirteen Weeks
Ended
Thirteen Weeks
Ended
Thirty-Nine Weeks
Ended
Thirty-Nine Weeks
Ended
October 1
October 2
October 1
October 2 |
 Income Statement (Consolidated)
17
Thirteen Weeks
Ended
Thirteen Weeks
Ended
Thirty-Nine Weeks
Ended
Thirty-Nine Weeks
Ended
October 1
October 2
October 1
October 2
2011
2010
2011
2010
78,593
$
72,349
$
249,839
$
181,828
$
54,248
48,342
166,664
119,617
24,345
24,007
83,175
62,211
14,002
11,145
41,953
25,496
9,096
8,156
25,739
20,288
4,449
4,102
14,048
10,269
1,676
1,665
5,531
3,841
338
919
3,328
1,164
29,561
25,987
90,599
61,058
(5,216)
(1,980)
(7,424)
1,153
201
134
279
185
(291)
(214)
(758)
(214)
(90)
(80)
(479)
(29)
(5,306)
(2,060)
(7,903)
1,124
2
10,979
215
12,154
(5,308)
$
(13,039)
$
(8,118)
$
(11,030)
$
(0.17)
$
(0.43)
$
(0.27)
$
(0.36)
$
30,571,472
30,357,988
30,521,529
30,225,194
Net sales
Cost of sales
Gross profit
Operating expenses:
General and administrative
(1)
Marketing
(1)
Fulfillment
(1)
Technology
(1)
Amortization of intangibles and impairment loss
Total operating expenses
(Loss) income from operations
Other income (expense):
Other income
Interest (expense) income
Other (expense) income, net
(Loss) income before income taxes
Income tax provision (benefit)
Net (loss) income
Basic net (loss) income per share
Shares used in computation of basic net income (loss) per share
|
 October 1, 2011
January 1, 2011
ASSETS
(unaudited)
Current assets:
Cash and cash equivalents
15,151
$
17,595
$
Short-term investments
1,117
1,062
Accounts receivable,
net of allowance of $194 and $372, respectively 8,805
5,339
Inventory
45,717
48,100
Deferred income taxes
360
359
Other
current assets 4,444
5,646
Total current assets
75,594
78,101
Property and equipment, net
34,800
33,140
Intangible assets, net
15,456
18,718
Goodwill
18,854
18,647
Investments
2,104
4,141
Other non-current
assets 981
790
Total
assets 147,789
$
153,537
$
LIABILITIES AND STOCKHOLDERS’ EQUITY
Current liabilities:
Accounts payable
33,833
$
31,660
$
Accrued expenses
15,480
15,487
Notes Payable, current
portion 6,250
6,125
Capital Leases
payable, current portion 128
132
Other
current liabilities 7,454
5,522
Total current
liabilities 63,145
58,926
Non-current liabilities
Notes Payable, net of current portion
13,188
17,875
Capital Leases payable, net of
current portion 67
185
Deferred
tax liabilities 3,233
3,046
Other non current
liabilities 983
701
Total
liabilities 80,616
80,733
Commitments and
contingencies —
—
Stockholders’ equity:
Common stock, $0.001 par value; 30,587,401 and 30,429,376 shares
issued and outstanding as of 10/1/11 and 1/1/11,
respectively 31
30
Additional paid-in capital
156,372
153,962
Accumulated other comprehensive income
325
249
Accumulated deficit
(89,555)
(81,437)
Total stockholders’ equity
67,173
72,804
Total liabilities and
stockholders’ equity 147,789
$
153,537
$
Balance Sheet
18 |
 Thank You
19
*
*
*
*
*
*
*****
*****
*****
*****
*****
*****
*****
***** |